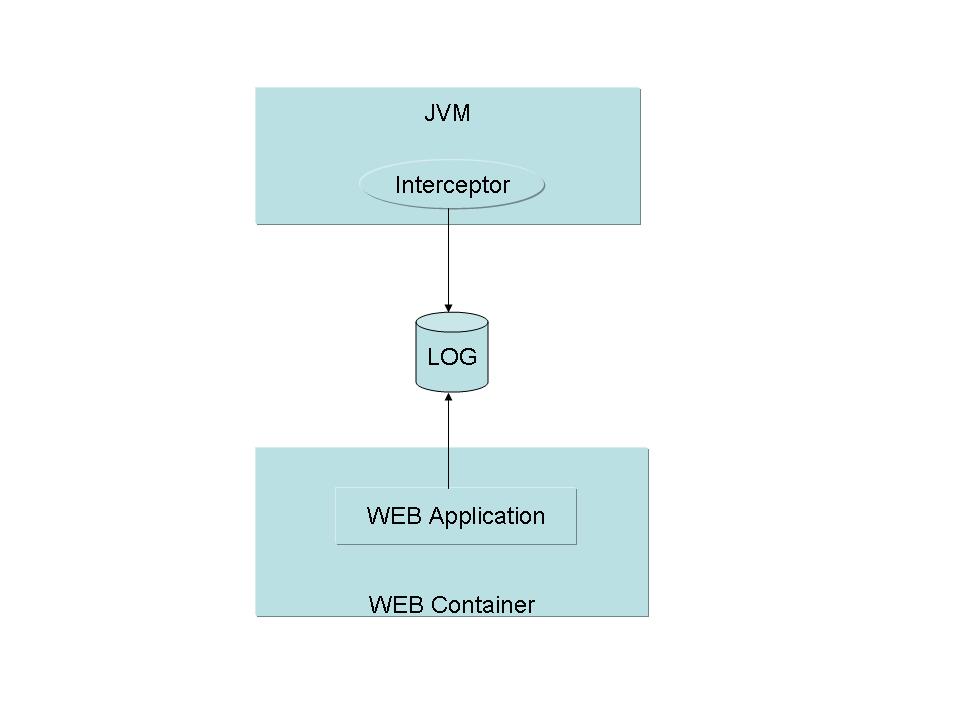
The idea is simple, an interceptor sends events to a LOG file. Another application (WEB application) reads its contents and shows analysis.
Most of the work is done by the Analysis tool, and that's a good thing as the work of analyzing the application is done outside of the JVM's runtime. What I have seen from users is that this increases the possibility of analysis and the user ends up capturing more information.
Also, the idea of the interceptor is to stay "sleeping" until someone wakes him up. This is always done by MBeans and there is a MBean that manages each interceptor.
JVMPI is the interface defined for profiler events until JVM 1.4. It's still supported in JVM 1.5, but will be removed soon. JVMPI is an experimental C interface where you can capture events like enter method, exit method, class-loading.
When the interceptor is active, these events are saved in binary files for later processing:
ClassLoad
Enter Method / Enter Exit
Object Alloc/Object Release
GCStart/GCFinish
Add the -XrunjbossInspector:<directory>,<options...> as a parameter to your JVM. (Sun's or IBM's JVM)
Possible options include:
start=<prefix name>
include=<prefix name>
ignore=<prefix name>
socket=<server|IP>:<port>
uniqueNames=true
wakeupOnStartup=true
Start the profiler always after the JVM start.
This is useful for running testcases.
memory=true|false (default=true)
Disable ObjectAlloc and ObjectRelease events.
tracer=true|false (default=false)
Enable MethodEntry and MethodExit events of Exception and Erorr classes
To weak up this interceptor you would have to use the MBean
JVMTI is the replacement for JVMTI after Java 5.
We will re implement events defined at JVMPI(Section 1.2, “JVMPI - Java Virtual Machine Profiler Interface”), but for now we are only using this to capture memory profiler snapshots (Section 3.2, “Capturing a Snapshot”)
The first thing that differs JBossProfiler is its conception based in LogFiles instead of wired protocols. This gives the tool more power plus enabling remote teams to analyze remote scenarios with minimal setup on servers.
Usually I say that JBossProfiler has enough features to find bottlenecks.
Features that both JBossProfiler and Commercial Tools will have:
Tree Navigation over the graph of callings
Graph visualization of the graph of callings
% Identification of Bottlenecks
There are of course features unique to JBossProfiler. Original ideas:
LogFile based
This is idea to support teams, where the problem is away from your analysis tool.
Also, this seems to increase the power of analysis. Usually you can analyze more data with JBossProfiler.
Memory Profiler based in Snapshot using only a server MBean
A commercial profiler requires a front-end installed in order to create the snapshot.
Object allocations and Object Releases referenced to methods
I haven't seen that feature in any other profiler
Usually commercial profilers are developer's tools, and of course they have more developers features like nice integrations with IDEs and Debuggers and views that can and sell lot of functionality. Well, we don't want to compete with commercial profilers but we want to offer a nice view about what is happening with your code and understand what is happening.
Sometimes of course is more comfortable to use commercial tools but you can always have the information you need with JBossProfiler