When using the Runtime Profiler, you are interested in the behavior of your methods during execution.
We extract information about method calls showing % information relative to CPU and elapsed time. We also show information about memory consumption from these methods.
Say, if a method allocates an object, you will have an enter-method event, and a objectalloc during its execution.
Later on, when you have a GC operation we will have release objects events. As we identified the object during its creation we can determine where the object was created, so we can show if a method is generating leaks or not.
The interceptor stays sleeping, not consuming any resources from the JVM until it receives a weak-up method.
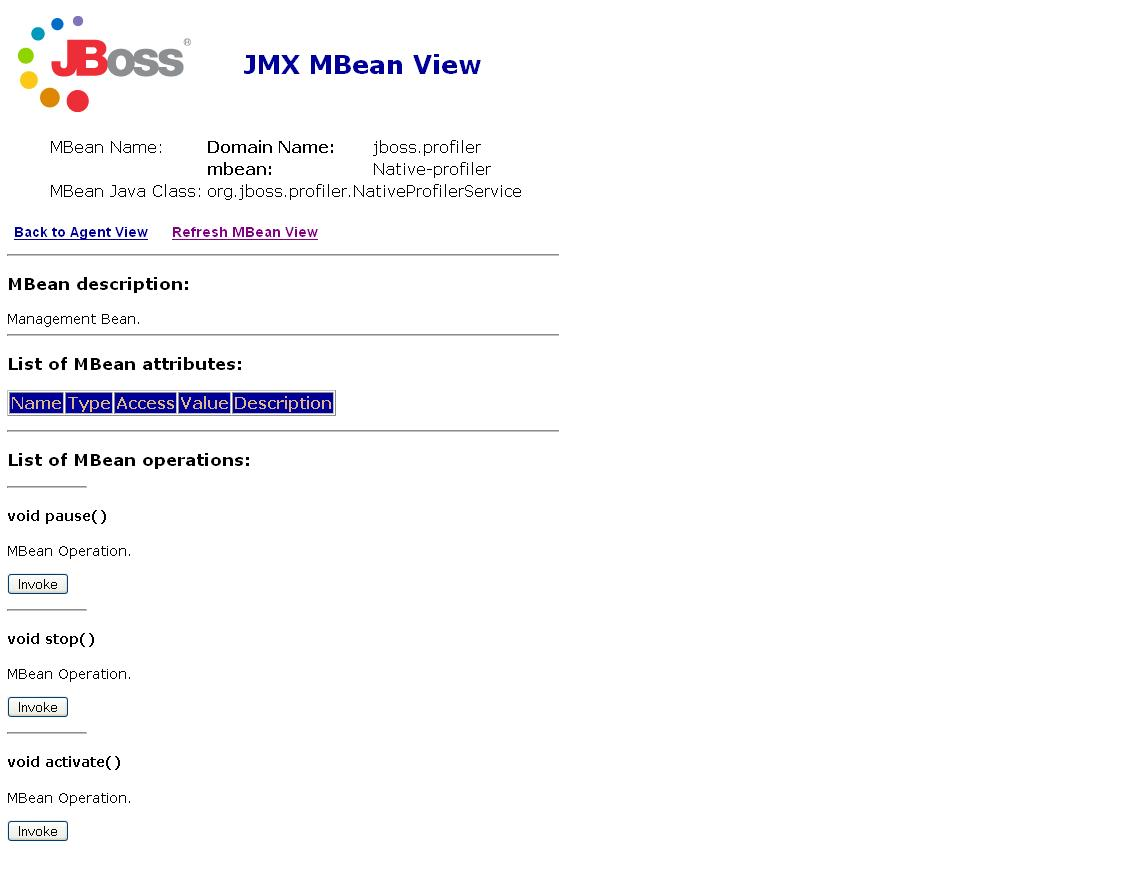
This is done by the MBean at the WebConsole. (e.g. http://localhost:8080/jmx-console).
You have to look for the bean mbean=Native-profiler
After you have selected the MBean you will be able to:
pause - Temporarily stops data collection
stop - Definitely close all the files
After this point, you can't collect more data and you need to restart your application server if you want to collect more.
After this point also, the application keeps running.
activate - Start/Resume capturing data
To install the Native MBean you need to copy jboss-profiler-noAOP.sar into your /server/deploy directory
The only thing needed to have access to the native library, is to have defined LD_LIBRARY_PATH (if Linux) or under the PATH (for Windows).
Although sometimes is hard to distribute native code under Linux. On that case you would have to recompile the native code in your library.
You can test if the installation works by doing a simple:
java -XrunjbossInspector:/tmp Foo
If the only error message you get is Class Foo not found, your native library installation is working
You have of course to download the source code from CVS first.
After you have download it, you need to:
Make sure you gnu/gcc works
Define JAVA_HOME to a JDK as we need access to some includes
Under <jboss-profiler-src>/native/<platform>, execute the compilation script
It is possible to directly use a org.jboss.profiler.threadcheck.StartupProfilerCheck to control the life cycle of your profiling.
StartupProfilerCheck is defined at profilerConsole.jar. You have three methods defined:
private native static void startProfilerInternal();
private native static void pauseProfilerInternal();
private native static void stopProfilerInternal();
These three methods are defined at jbossInspector.dll (or .so for Solaris or .jnilib for apple)