To start analyzing after the deployment, open this URL into your WEB-Browser.
http://localhost:8080/jboss-profiler
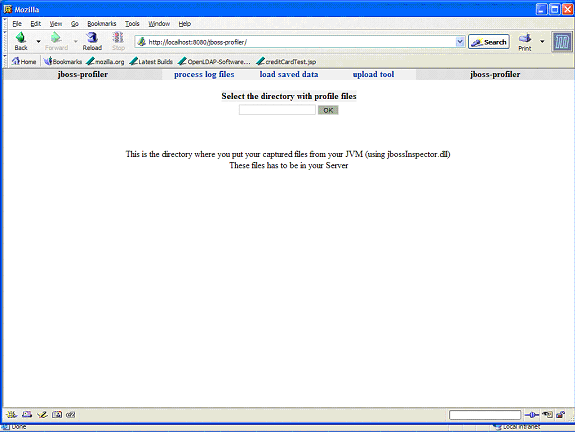
You will have to type the directory where you added the log files. It was not possible to create a select button as this is a Web application. The good thing about a WebApplication for a profiler, is that you can have people analyzing data remotely. (This is a good tool for consultants. support staff and architects that may not be on site)
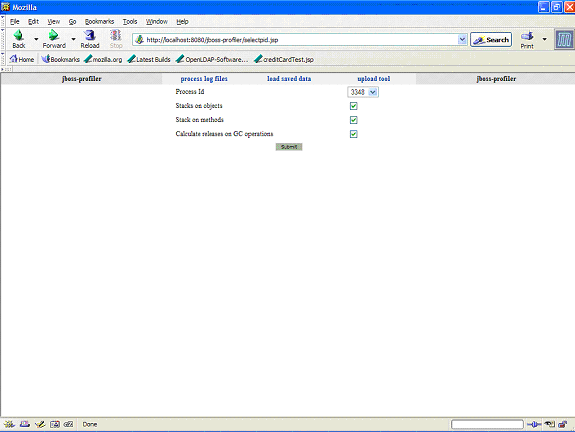
Besides the option to select any process id you might need, you have also three extra options that will control how to analyze the log-files into profiler’s object-model:
Stack on objects
You can locate where objects are created if this feature is enabled
Stack on methods
You can generate the iteration between methods callings. If not activated you won’t have reference information between methods.
Calculate releases on GC operations
If activated a complete reference between object ids and methods ID. It’s a good option to locate memory-leaks
After submit this following processing screen will be viewed.
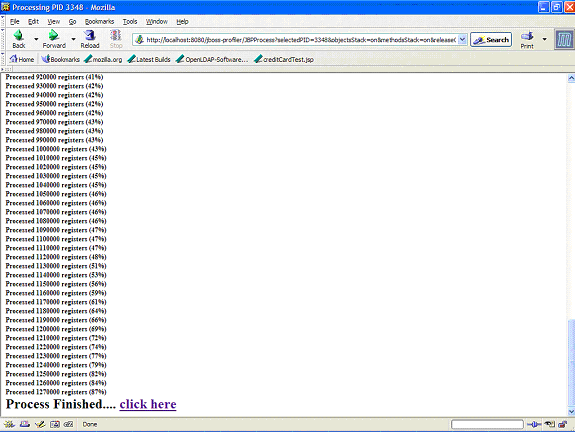
Follow the link, and you will see Process-View/Methods view as default: You can have this view by clicking on ProcessView-methods.
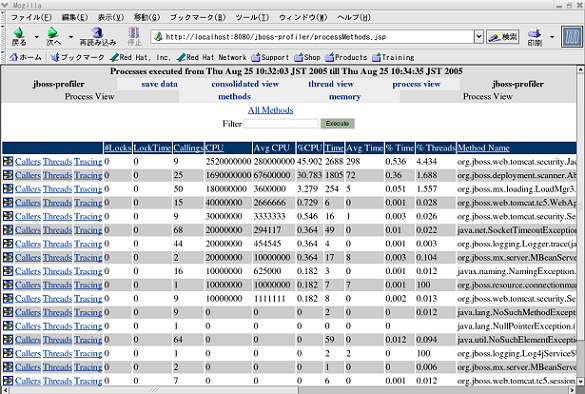
You can proceed from this view to each of steps described in the following sections respectively.
You can click on the arrow icon to detail method’s execution: You can repeat that operation as many times you want inside method’s execution. Clicking on method’s name (a hyperlink) has the same effect.
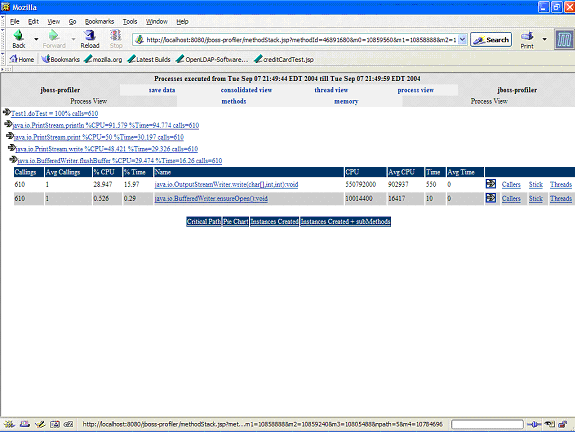
After you got on methods detail, you can have four views about the current graph:
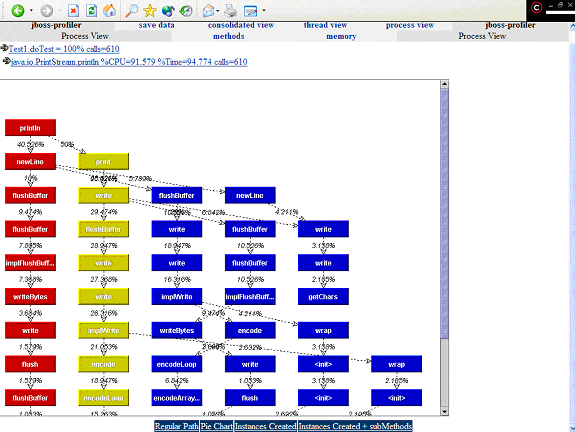
Critical Path
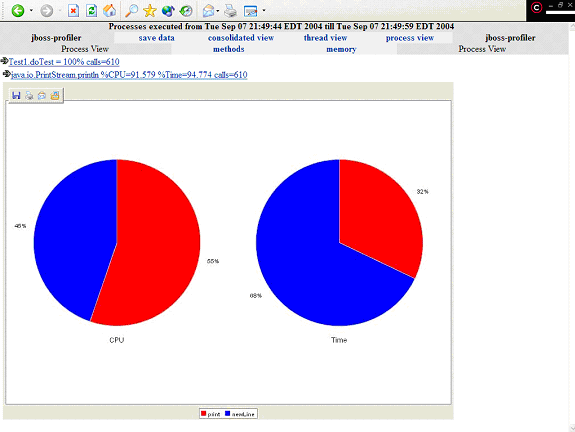
Pie Chart
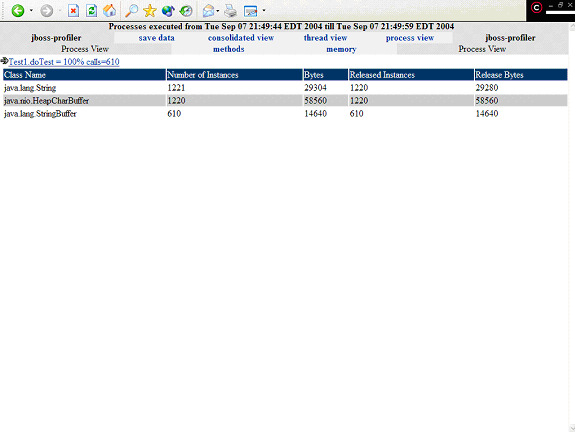
Instances Created:
(There is an extra view that adds sub-methods events)
On this view you have information about how many objects were created and released on that slice of the graph. You have a complete information about memory-leaks.
Memory operations (ProcessView->Memory)
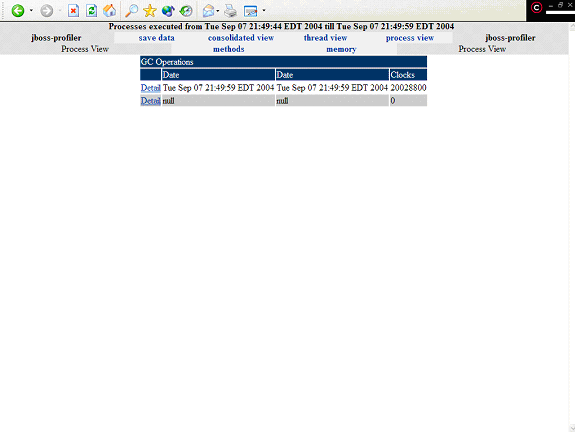
On Process-View/Memory you can look at GC operations:
You can detail a GC operation:
Byou
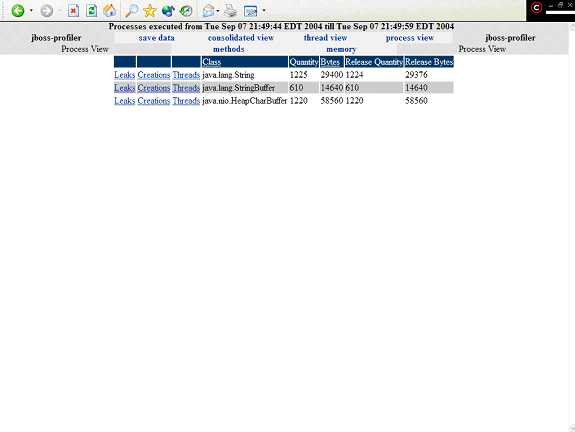
You can look for Leaks, have information about Creations or Threads on this view.
Consolidated View
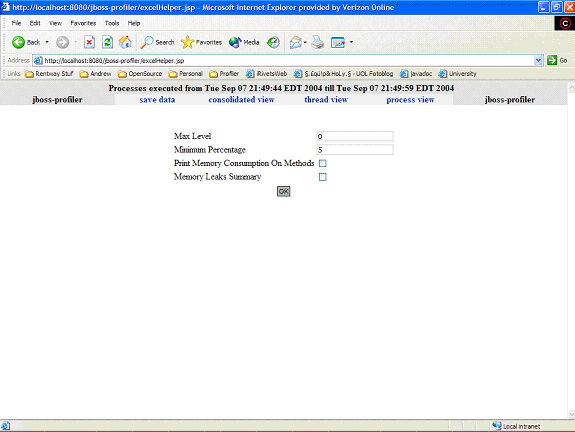
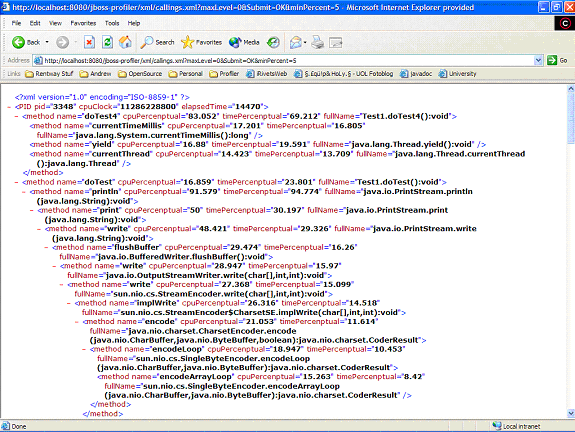
On consolidated view, after you set filter parameters, you can generate a XML, XLS or zipped XML about the model:
You can click on the "Tracing" field to detail the flow of "transaction" which is a sequence of methods executed in each method, and this following processing screen will be viewed.
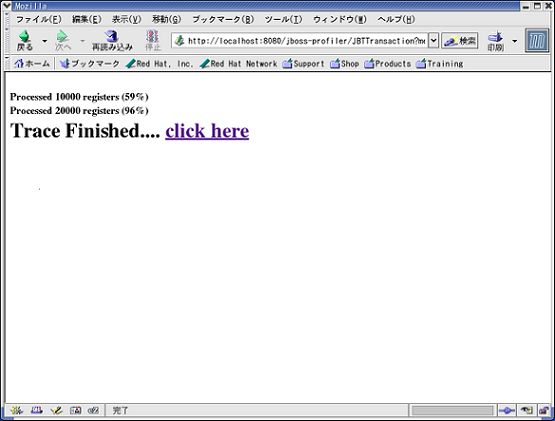
Follow the link, and you will see the following view.
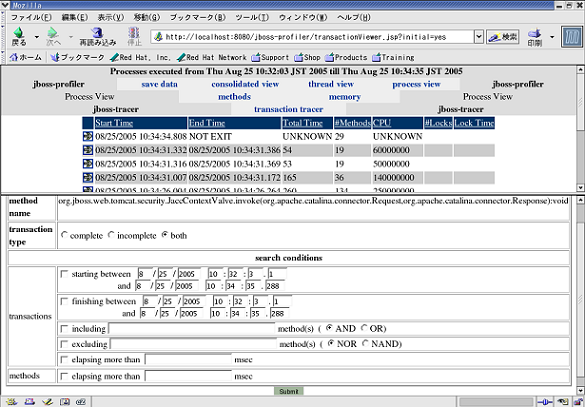
The upper part (list view) of the view lists all transactions of the clicked method. The lower part (search view) provides an interface where you can set conditions for searching specific transactions. The "search view" lists the following items.
start method name
Name of the clicked method.
transaction type
You can specify whether target transactions are complete or not. "Transaction type" has 3 choices.
complete
This choice picks up transactions which have completed from start to finish.
incomplete
This choice picks up transactions which have aborted halfway.
both
This choice picks up both "complete" and "incomplete" transactions. (default)
search conditions
For setting conditions, you have 6 options. If you select more than 1 option, target transactions will have to meet conditions of all the selected options. "Search conditions" has 6 choices.
Period where target transactions have started
Specify start time and finish time of the period as follows.
MM/dd/yyyy hh:mm:ss:SSS
Period where target transactions have finished
Specify start time and finish time of the period as follows.
MM/dd/yyyy hh:mm:ss:SSS
Any method(s) executed in target transactions
Specify any string which is a part of the method's name. You can specify more than one string by separating them by space(" "). If you do so, the tracer picks up transactions executing all of them (AND condition), or transactions executing at least one of them (OR condition).
Any method(s) not executed in target transactions
Specify any string which is a part of the method's name. You can specify more than one string by separating them by space(" "). If you do so, the tracer picks up transactions not executing any of them (NOR condition), or transactions not executing all of them (NAND condition).
Duration of target transactions
Specify duration by millisecond (SSS), and the tracer picks up transactions elapsing more than the duration.
Duration of any method executed in target transactions
Specify duration by millisecond (SSS), and the tracer picks up transactions including any method(s) elapsing more than the duration.
Set conditions as you like and submit, and the tracer picks up transactions meeting the conditions. The "list view" will be refreshed to list them. The table has the following fields.
Start Time
Start time of the transaction.
End Time
Finish Time of the transaction.
Total Time
Duration of the transaction by the millisecond.
#Methods
The number of methods executed in the transaction.
CPU
CPU usage time of the transaction in nanosecond.
#Locks
The number of locks in the transaction if any. If not, this field is empty.
Lock Time
Duration of the locks in the transaction in millisecond. If there is are no locks, this field is empty.
You can click on the arrow icon to detail each transaction. You will see "transaction details view".
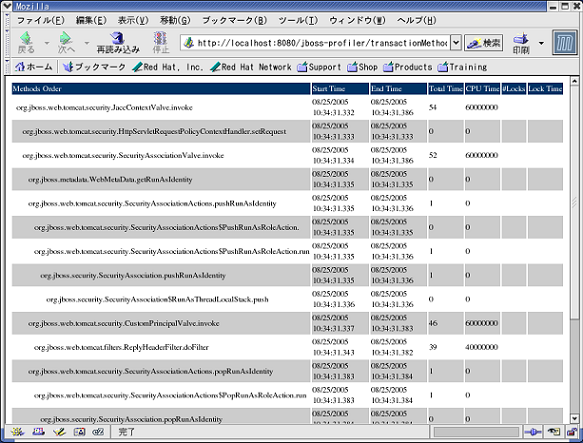
The table has the following fields.
Methods Order
Methods executed in the transaction are listed in sequence. Indented methods mean nests. If you have specified any executed method(s) on "search view" mentioned above, it/they is/are drawn in different color from other methods.
Start Time
Start time of each method.
End Time
Finish time of each method. If you have chose "both" or "incomplete" of "transaction type" item on "search view", this field says "NOT EXIT" for any incomplete methods.
Total Time
Duration of each method by the millisecond. If you have chose "both" or "incomplete" of "transaction type" item on "search view", this field says "UNKNOWN" for any incomplete methods.
CPU Time
CPU usage time of each method.
#Locks
The number of locks in each method if any. If not, this field is empty.
Lock Time
Duration of the locks in each method in millisecond. If there is are no locks, this field is empty.